The evaluation of core quality attributes is not enough to finally decide which implementation is better or not. The test execution time should be a key component too. In this article part of the Design & Architecture Series, we will examine a library that can help us measure the performance of our automated tests’ components. You will read about how to use the benchmarking tooling for exporting the results to various formats, profiling your test components CPU, memory and hard drive utilization, and more.
For more detailed overview and usage of many more design patterns and best practices in automated testing, check my book “Design Patterns for High-Quality Automated Tests, C# Edition, High-Quality Tests Attributes, and Best Practices”. You can read part of three of the chapters:
Defining High-Quality Test Attributes for Automated Tests
Generic Repository Design Pattern- Test Data Preparation
What is Benchmarking?
Before defining benchmarking, would you like to answer the question- what is performance?
Definition
Performance – in the context of automated testing, it can mean two things- certain operations to take less time, e.g., run faster. A second important factor is reducing memory usage and allocations. Or said with other words- “doing more with less”.
Here is the official definition for “performance efficiency” by ISTQB Glossary:
Definition
Performance efficiency – the degree to which a component or system uses time, resources and capacity when accomplishing its designated functions. (ISTQB Glossary)
Now how about creating a benchmarking tooling so that we can measure the performance of our components? Of course, we won’t reinvent the wheel but, instead, use a standard solution.
Benchmarking Your .NET Code with BenchmarkDotNet
Benchmarking is hard. You can easily make a mistake during performance measurements. BenchmarkDotNet will protect you from the common pitfalls because it does all the dirty work for you: it generates an isolated project per each benchmark method, does several launches of this project, run multiple iterations of the function (including warm-up), and so on. Usually, it would help if you even didn’t care about the number of iterations because the library chooses it automatically to achieve the requested level of precision.
Main Features
BenchmarkDotNet has a lot of great features for in-depth performance investigations:
Standard benchmarking routine
-
Execution control
BenchmarkDotNet tries to choose the best possible way to evaluate performance, but you can also manually control the number of iterations, switch between cold start and warmed state, set the accuracy level, tune GC parameters, change environment variables, and more.
-
Statistics
By default, you will see the essential statistics like mean and standard deviation; but you can also manually ask for min/max values, confidence intervals, skewness, kurtosis, quartiles, percentiles, or define own metrics
-
Memory diagnostics
The library not only measure the performance of your code but also prints information about memory traffic and the amount of GC collections
-
Disassembly diagnostics
You can ask for an assembly listing with the help of single additional attribute
-
Parametrization
Performance can be evaluated for different sets of input parameters like in popular unit test frameworks
-
Environment information
When your share performance results, it’s crucial to share information about your environment; BenchmarkDotNet automatically prints the exact version of your OS and processor; amount of physical CPU, physical cores, and logic cores; hypervisor (if you use it); frequency of the hardware timer; the JIT-compiler version; and more.
-
Command-line support
You can manage thousands of benchmark, group them by categories, filter and run them from the command line
BenchmarkDotNet Example
It’s straightforward to start using BenchmarkDotNet. Let’s look at an example:
[ClrJob(baseline: true), CoreJob, MonoJob, CoreRtJob]
[RPlotExporter, RankColumn]
public class Md5VsSha256
{
    private SHA256 sha256 = SHA256.Create();
    private MD5 md5 = MD5.Create();
    private byte[] data;
    [Params(1000, 10000)]
    public int N;

    public void Setup()
    {
        data = new byte;
        new Random(42).NextBytes(data);
    }

    public byte[] Sha256() => sha256.ComputeHash(data);

    public byte[] Md5() => md5.ComputeHash(data);
}
public class Program
{
    public static void Main(string[] args)
    {
        var summary = BenchmarkRunner.Run<Md5VsSha256>();
    }
}
BenchmarkDotNet allows designing a performance experiment in a user-friendly declarative way. At the end of the experiment, it will generate a summary table which contains only essential data in a compact and understandable form:
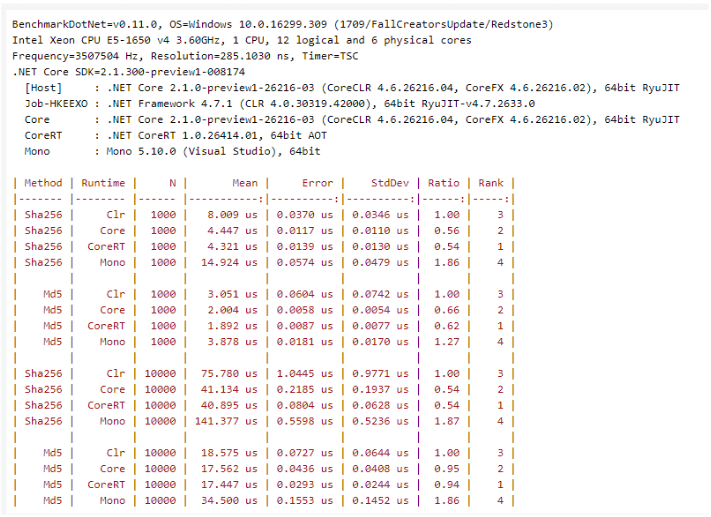
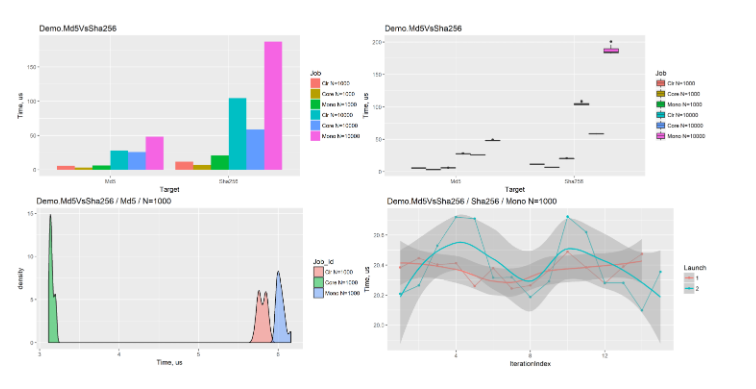
In artifacts, you can also find detailed information about each iteration. You can export the data in different formats like (CSV, XML, JSON, and so on) or even generate beautiful plots:
Note
To start using BenchmarkDotNet, create a new console application. Install the NuGet package BenchmarkDotNet. Then write a class with methods that you want to measure and mark them with the Benchmark attribute. Finally, call the Run method of the BenchmarkRunner class.
Note
Never use the Debug build for benchmarking. Never! The debug version of the target method can run 10–100 times slower. The release mode means that you should have
true in your csproj file or use /optimize for CSC. Also, it would be best if you have never used an attached debugger during the benchmarking. The best way is to build our benchmark in the Release mode and run it from the command line. However, if you need to debug your benchmarks use the InProcess attribute.
Benchmark Button Click Solutions
There are various use cases where you can utilize benchmarking so that you make better choices concerning the speed of your tests. The simplest scenario that we will look into is choosing between the usage of regular vanilla WebDriver click method calls against JavaScript calls.
Button Benchmark Experiment
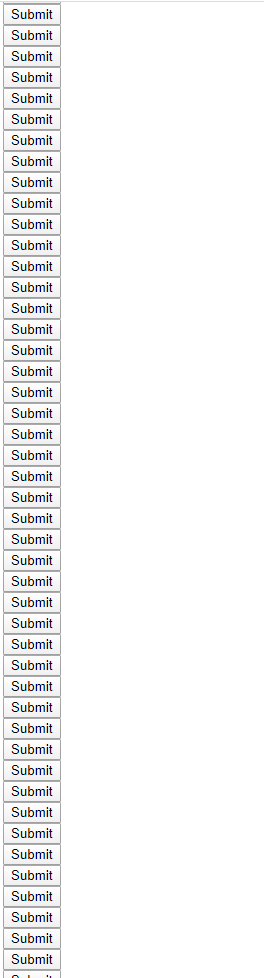
I created a simple demo HTML page where you can find a couple of screens of HTML buttons. Our two experiments or benchmarks will be to compare the clicking on all these buttons through vanilla WebDriver and afterward through JavaScript.
public class ButtonClickBenchmark
{
    private const string TestPage = "http://htmlpreview.github.io/?https://github.com/angelovstanton/AutomateThePlanet/blob/master/WebDriver-Series/TestPage.html";
    private static IWebDriver _driver;
    private static IJavaScriptExecutor _javaScriptExecutor;

    public void GlobalSetup()
    {
        _driver = new ChromeDriver(DriverExecutablePathResolver.GetDriverExecutablePath());
        _javaScriptExecutor = (IJavaScriptExecutor)_driver;
        _driver.Navigate().GoToUrl(TestPage);
    }

    public void GlobalCleanup()
    {
        _driver?.Dispose();
    }
    [Benchmark(Baseline = true)]
    public void BenchmarkWebDriverClick()
    {
        var buttons = _driver.FindElements(By.XPath("//input[@value='Submit']"));
        foreach (var button in buttons)
        {
            button.Click();
        }
    }

    public void BenchmarkJavaScriptClick()
    {
        var buttons = _driver.FindElements(By.XPath("//input[@value='Submit']"));
        foreach (var button in buttons)
        {
            _javaScriptExecutor.ExecuteScript("arguments[0].click();", button);
        }
    }
}
The GlobalSetup method is executed once for each benchmark iteration. There we navigate to our demo page only once per cycle. You will notice that the initialization of ChromeDriver is a bit weird. I used the class DriverExecutablePathResolver. The reason for this is that usually the benchmarks are done in two separate processes, and BenchmarkDotNet is generating a different folder and a project for the experiments thus the actual execution of the benchmark is not happening in the folder where the chrome driver executable is located which means that if you use something like this:
string assemblyFolder = Path.GetDirectoryName(Assembly.GetExecutingAssembly().Location);Your test will fail because it cannot locate the driver executable. The resolver class returns the correct parent folder where the drivers live.
public static class DriverExecutablePathResolver
{
    public static string GetDriverExecutablePath()
    {
        string assemblyFolder = Path.GetDirectoryName(Assembly.GetExecutingAssembly().Location);
        var directoryInfo = new DirectoryInfo(assemblyFolder);
        for (int i = 0; i < 4; i++)
        {
            directoryInfo = directoryInfo.Parent;
        }
        return directoryInfo.FullName;
    }
}
To execute the button experiment following the instructions, I created a .NET Core console application and installed the BenchmarkDotNet NuGet package. This is the code of the Main method.
public class Program
{
public static void Main(string[] args)
{
var summary = BenchmarkRunner.Run<ButtonClickBenchmark>();
Console.WriteLine(summary);
}
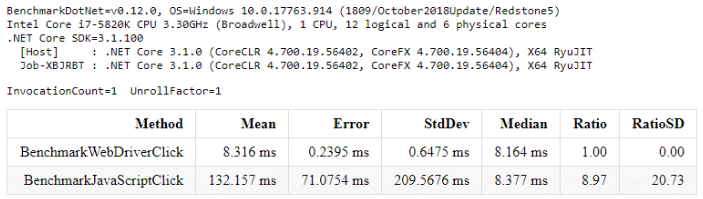
}Here are the results after the execution.
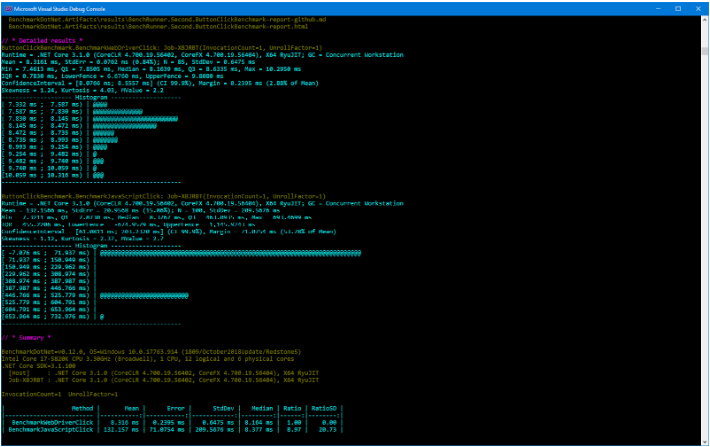
It looks like the vanilla WebDriver native Click is much more performant than the JavaScript approach. Mean 8.3 ms against 132.2 ms, which is almost a 1500% increase in time! You can find the complete execution logs in the BenchmarkDotNet.Artifacts folder.
Benchmark Reports, Profiling, Disassembly Diagnoser
BenchmarkDotNet can generate rich reports, profile the code under experiment and provide CPU, memory, and other hardware usage info. Additionally, it can display the MSIL version of the tested code.
Benchmark HTML and CSV Reports
As mentioned in the section about the BenchmarkDotNet features, the tool supports lots of reports. I particularly like the HTML and CSV ones. To generate them use the CsvExporter and HtmlExporter attributes.
public class Program
{
    public static void Main(string[] args)
    {
        var summary = BenchmarkRunner.Run<ButtonClickBenchmark>();
        Console.WriteLine(summary);
    }
}
After the execution, you can find the generated reports in the BenchmarkDotNet.Artifacts\results folder.
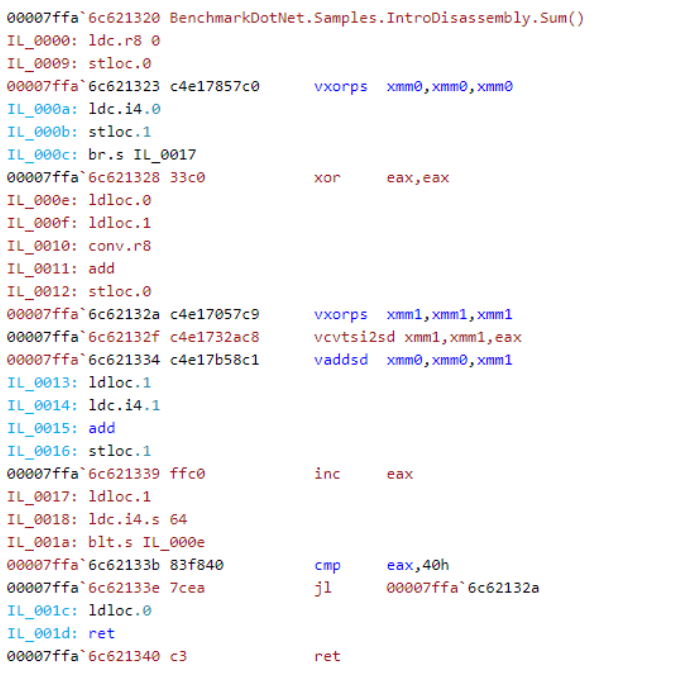
Benchmark Disassembler
To view the disassembly of your code, use the DisassemblyDiagnoser attribute.
[DisassemblyDiagnoser(printAsm: true, printSource: true)]
public class Program
{
    static void Main(string[] args)
    {
        var summary = BenchmarkRunner.Run<ButtonClickBenchmark>();
        Console.WriteLine(summary);
    }
}
The configuration options available from code level are:
-
printIL
IL will be printed. False by default.
-
printAsm
ASM will be printed. True by default.
-
printSource
C# source code will be printed. False by default.
-
printPrologAndEpilog
ASM for prolog and epilog will be printed. False by default.
-
recursiveDepth
Includes called methods to a given level. 1 by default, indexed from 1. To print, just benchmark set to 0. This option is also available from the console arguments level —disasmDepth.
DisassemblyDiagnoser requires following settings in your csproj file:
<PropertyGroup>
    <PlatformTarget>AnyCPU</PlatformTarget>
    <DebugType>pdbonly</DebugType>
    <DebugSymbols>true</DebugSymbols>
</PropertyGroup>
To get the source code, it needs to locate and read the PDB files. This is why the tool needs DebugType and DebugSymbols settings. To compare different platforms, the project which defines benchmarks has to target AnyCPU.
Here is a sample output.
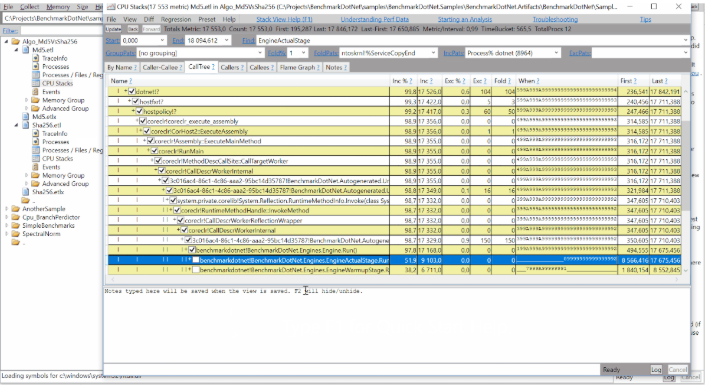
Benchmark Profiling
BenchmarkDotNet allows us to profile the benchmarked .NET code on Windows and exports the data to a trace file that can be opened with PerfView or Windows Performance Analyzer. There you can check CPU, RAM, hard-drive, network usage of the experiments. It uses the TraceEvent library, which internally uses Event Tracing for Windows (ETW) to capture stack traces and important .NET Runtime events.
The profiler requires to run the app with Administrative permissions and use the following settings in your csproj file:
<PropertyGroup>
    <DebugType>pdbonly</DebugType>
    <DebugSymbols>true</DebugSymbols>
</PropertyGroup>
To use the profiler use the EtwProfiler attribute.
public class Program
{
    static void Main(string[] args)
    {
        var summary = BenchmarkRunner.Run<ButtonClickBenchmark>();
        Console.WriteLine(summary);
    }
}
Summary
We talked about what benchmarking is and how to measure the performance of various automated tests’ components. We investigated how to utilize BenchmarkDotNet library for the job and how to use it to generate statistics, trace files, and disassemble executed code.